
So… what is my Masters Scorecard?
When I set out to build this score, I wasn’t trying to create the next big betting model or replicate some deep machine learning magic, however I for sure did want to test my ability to predict some round scores and analyze the data in a way that gave me some clear cut favorites. I think the Masters is always going to have the same clear cut favorites, whether the data says they are or not. However, what could the data the way I see it/want to use it tell me?
This is a blend of historical performance, current form, and good ol’ fashioned score-making.
Let’s break it down ⬇️
Strokes Gained Analysis – The Backbone
If you want to know what it takes to win at Augusta, just look at the last golfers who were able to get it done.
I took the last 3 Masters champions and found their average numbers across the five big Strokes Gained categories:
- Putting
- Around the Green
- Off the Tee
- Tee to Green
- Total
This average becomes the “Winners Benchmark.”
Then, I analyzed:
- Every Masters round played by this year’s field in the past 3 years
- Every 2025 tournament round
If a player exceeded the winner’s benchmark in any category during a Masters round? 👉 1 full point.
If they did it in a 2025 round? 👉 ½ point.
We total that up to get each player’s Strokes Gained Score — a strong reflection of who’s shown the kind of elite performance Augusta rewards.
Driving Score – Power Meets Precision
Augusta rewards big hitters, but it’s not a free-for-all. Distance matters, but accuracy matters just as much, especially with those tight lies and risk-reward holes.
This score is calculated exactly like the strokes gained section:
- I set a benchmark using average Driving Distance and Driving Accuracy of recent winners.
- Players earn points when they beat those averages — 1 point in a Masters round, ½ point in any 2025 round.
This helps identify the players with the driving profile that can attack Augusta — without ending up behind a Georgia pine.
Field Composition Score – Form & Confidence
Numbers are great, but confidence means so much more.
I looked at every player’s results since February 1, 2025.
Here’s how this one works:
- 1 point for every Top-10 finish.
- 1 extra point for any win.
The idea here is to capture momentum. If someone’s been playing well, they’re coming in with confidence — and that always matters on this stage, I thought about limiting this to just the last 5 weeks or the last 3 weeks, but there were too many good tournaments in February, where I felt like placing in the top 10 set up well for Augusta.
Birdie Score – Who’s Capitalizing?
Birdies (or better) are how you win at Augusta — well everywhere. Sure also don’t three putt and avoid penalty strokes, but we’re talking birdies baby.
So I ran the same analysis here:
- Each time a player posted a round in 2025 with birdies per round above the winner’s benchmark, they earned ½ point.
- Same goes for past Masters rounds — 1 point if they beat the benchmark.
This helps spotlight the guys who can make magic when opportunities arise.
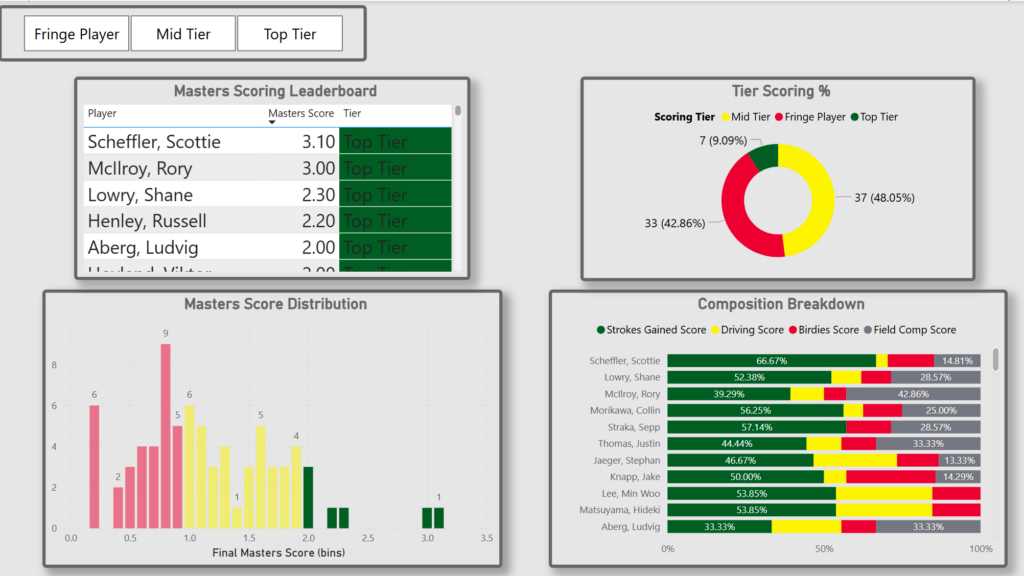
Pulling It All Together: The Weighted Masters Score
Once I have each of these four scores, I combine them into one final number using weights based on predictive value:
- Strokes Gained Score – 40%
- Driving Score – 20%
- Field Composition Score – 20%
- Birdie Score – 20%
Each score gets normalized, multiplied by its weight, and then added up to form one big Masters Score — a clean way to tier players based on stats that actually matter here.
What’s Next?
Now that the numbers are in, it’s time to see who actually stands out.
Tomorrow, I’ll reveal the tiers — who ranks at the top, which sleepers show up, and who might be flying under the radar.
Until then — go hit a few wedges and imagine you’re sticking one close on 12. See you Wednesday!